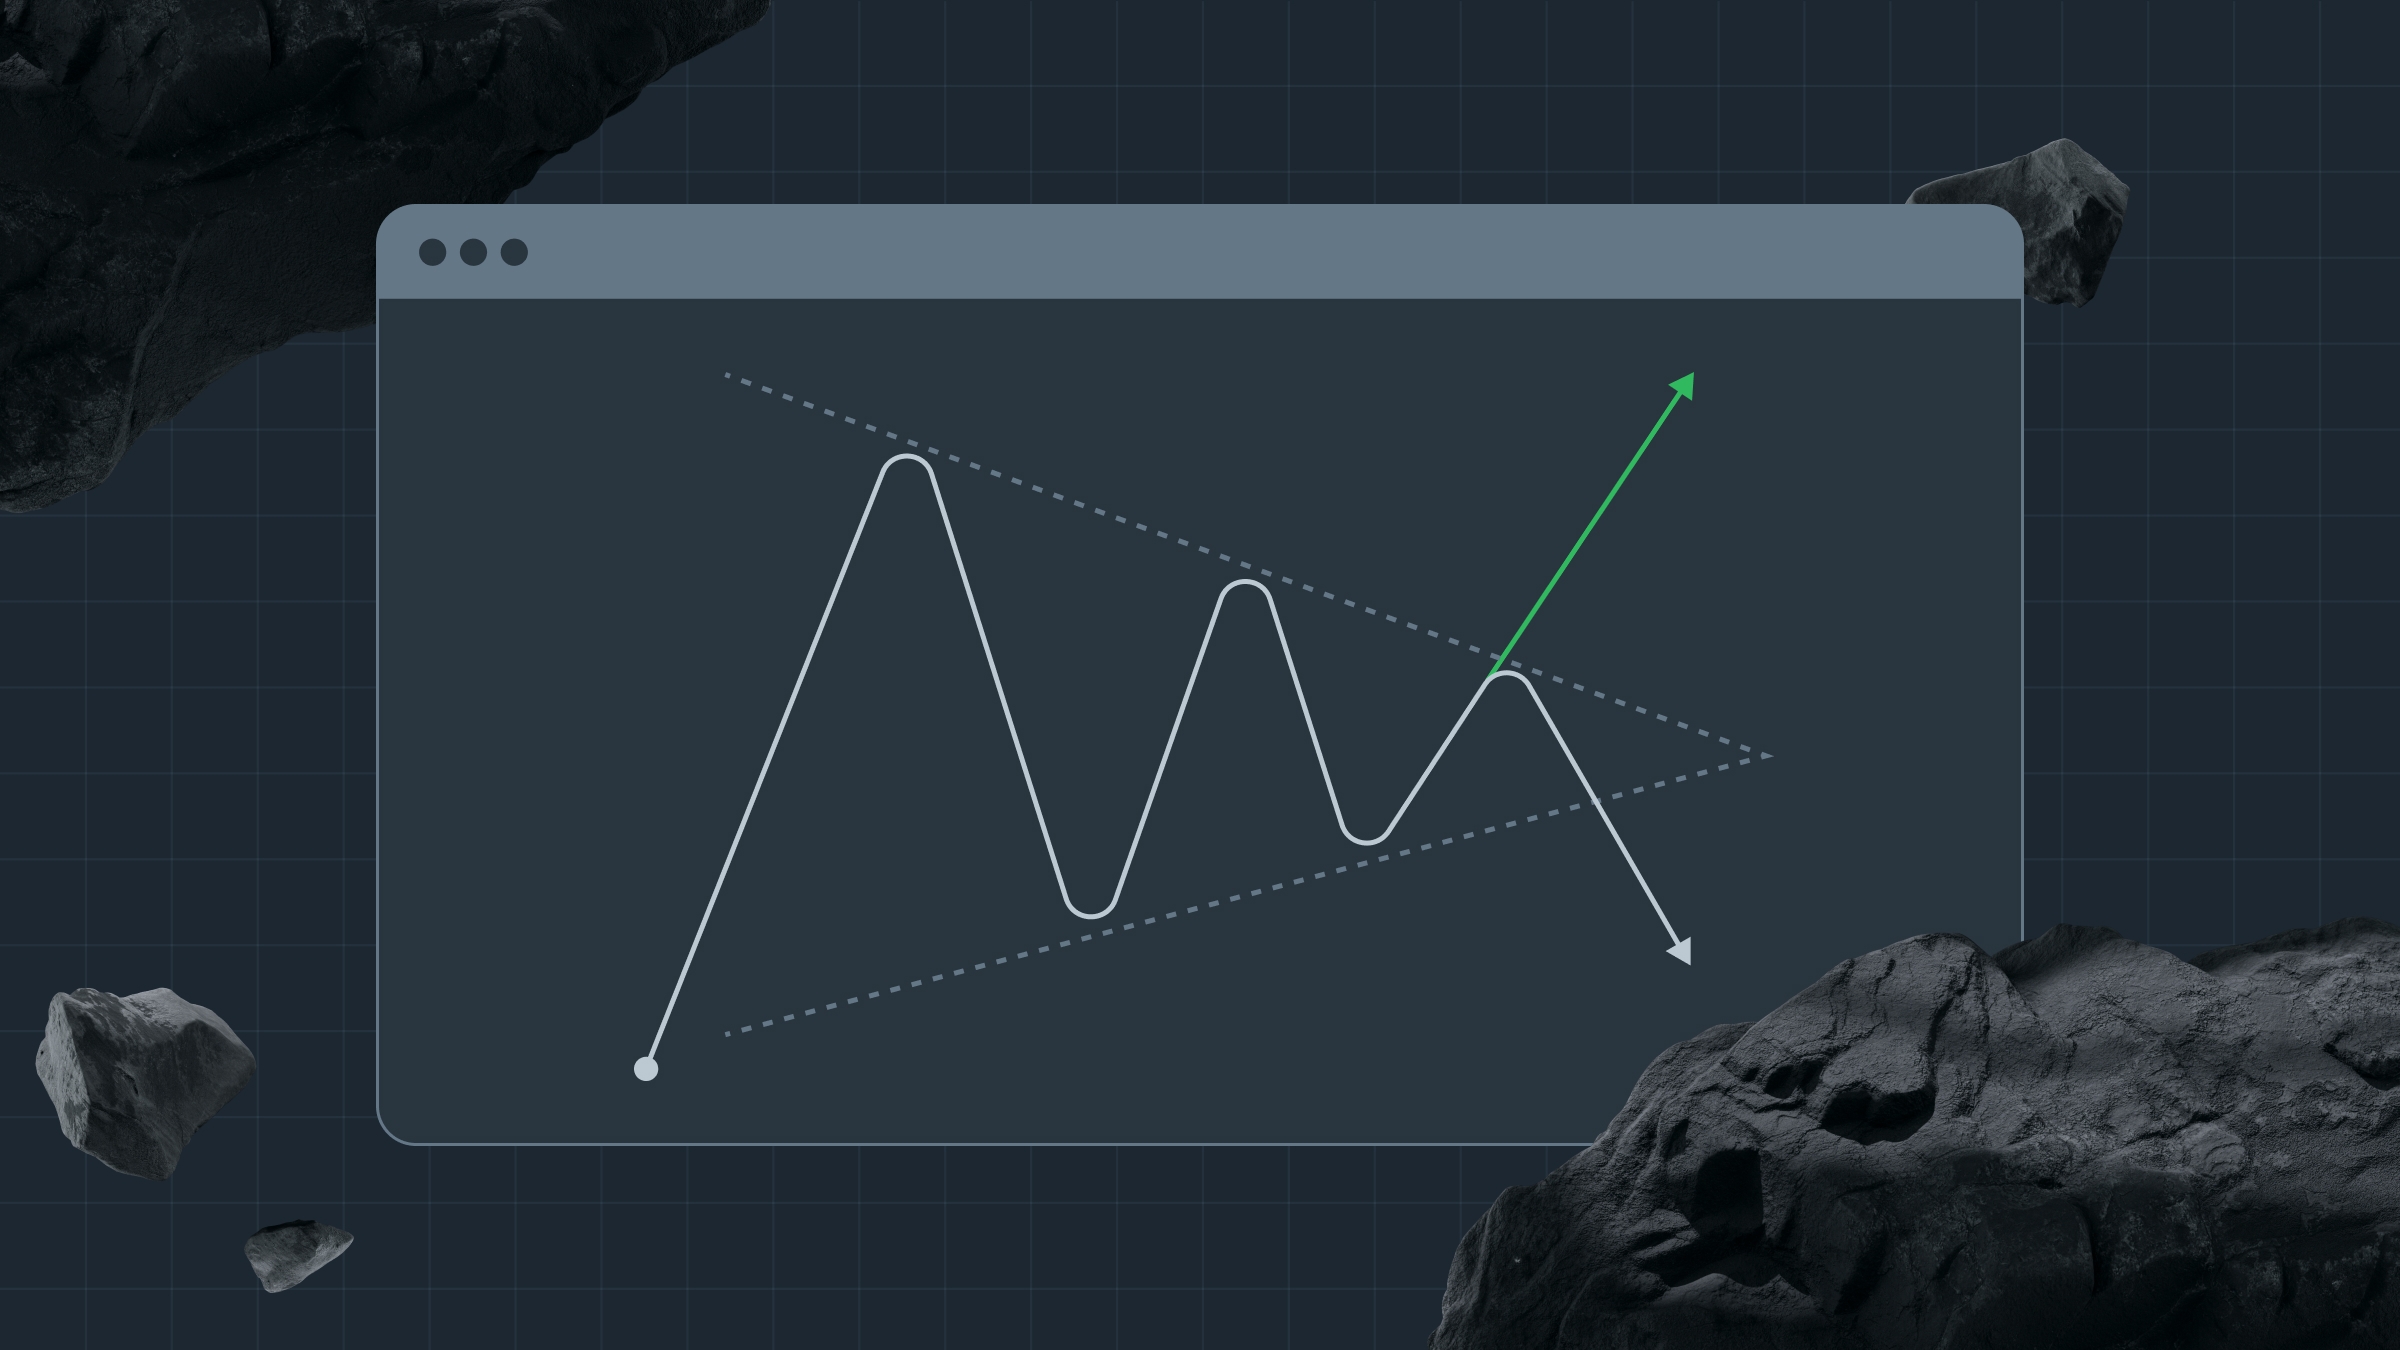
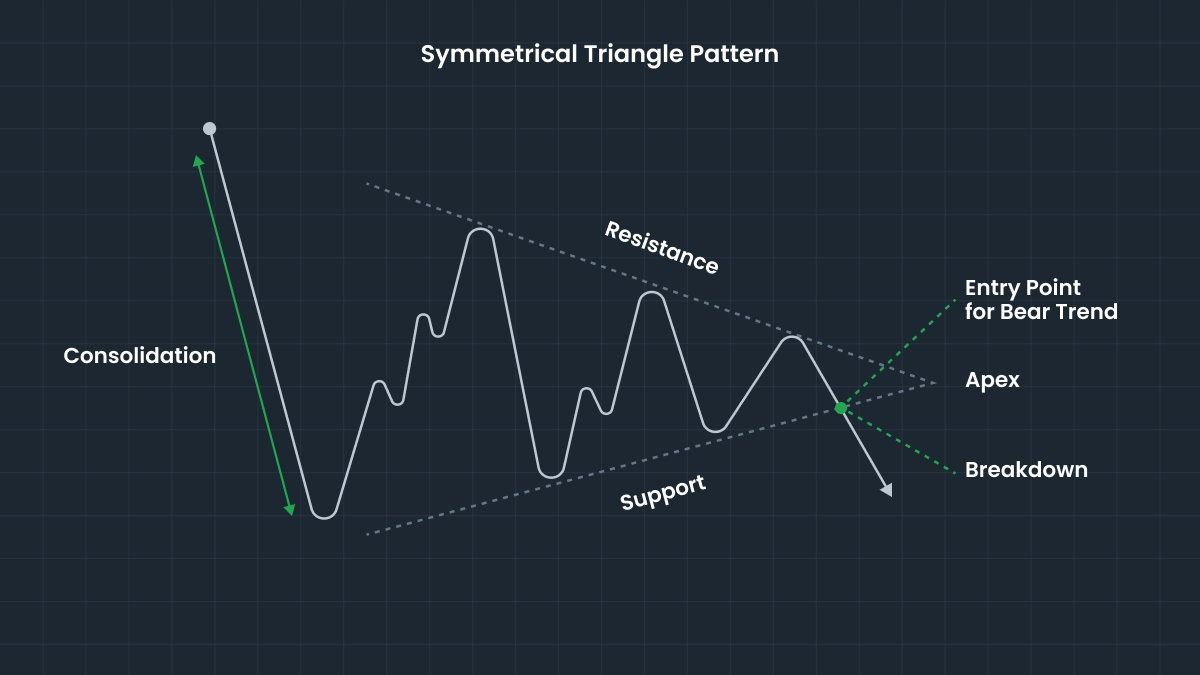
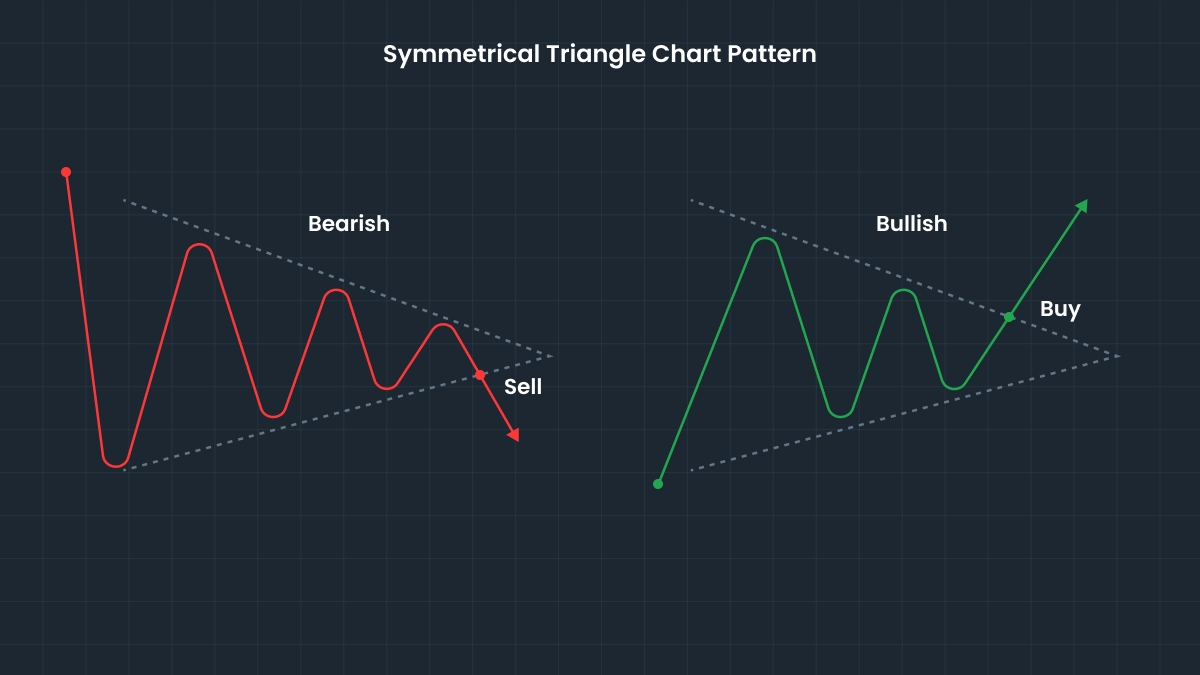
If the breakdown originates from the lower trend line, the following trend will be bearish; and, on the contrary, a breakout from the upper trend line signals the start of a bullish trend.
However, it is important not to mistake this pattern for Wedges! The two trend lines must converge at a single point in the future. We’ll break down the differences between a Symmetrical Triangle and other patterns below.
If you want to learn more about essential patterns in technical analysis, read the FBS article “Top 15 Most Significant Stock Chart Patterns”.
Is a Symmetrical Triangle Pattern bullish or bearish?
Unlike some other chart patterns, the Symmetrical Triangle does not in and of itself signal a bullish or bearish trend. Instead, it is considered neutral: it often continues the existing trend, and the actual breakout direction depends on market sentiment. In other words, the pattern does not help predict the direction in which the price will move, but it creates conditions for a potentially strong movement in either direction.
How to calculate the price target for a breakout or breakdown from a symmetrical triangle
To calculate the price target, traders use a method based on the height of the triangle.
First, measure the height of the triangle: subtract the first low from the first high. For example, the highest point at the start of the triangle is $110, and the lowest point is $100. That makes the height $10.
Then identify the breakout or breakdown point (the price level where the breakout or breakdown occurs).
The final step: for a bullish breakout, simply add breakout point plus height. For example, the breakout happens at $108 and the triangle height is $10. In this case the price target $108 plus $10 equals $118.
For a bearish breakdown subtract the height from the breakdown point. For instance, the breakdown happens at $98 and the triangle height is $10. The price target is then $88 ($98 minus $10 equals $88).
Traders often place a stop-loss order just below the breakout point to reduce risk if the breakout fails (known as a “false breakout”).
Trade with confidence! Join FBS now.