Institutional traders still rely on Wyckoff principles, but on a different timeframe. For example, a pension fund can short over a series of weeks at a wide range top, hiding its exits in algorithmic icebergs, while a retail swing trader may simply short the initial breakdown after some up-thrust. Knowing that both parties are governed by the same law of supply and demand, but to a different degree, small operators can keep out of the way of big distribution and ride the next markdown instead.
The most compelling feature of the Wyckoff Strategy for today’s world is its focus on volume, a parameter ignored by many popular oscillators. And volume often reveals concealed interest well before a moving average crossover or an RSI divergence alert.
Knowing how useful the Wyckoff Strategy is, most advanced charting software tools have features that let users implement it. Many platforms offer scripts that automatically label market phases to help users concentrate on risk management only. For example, TradingView has indicators that enable a trader to duplicate the Wyckoff toolkit.
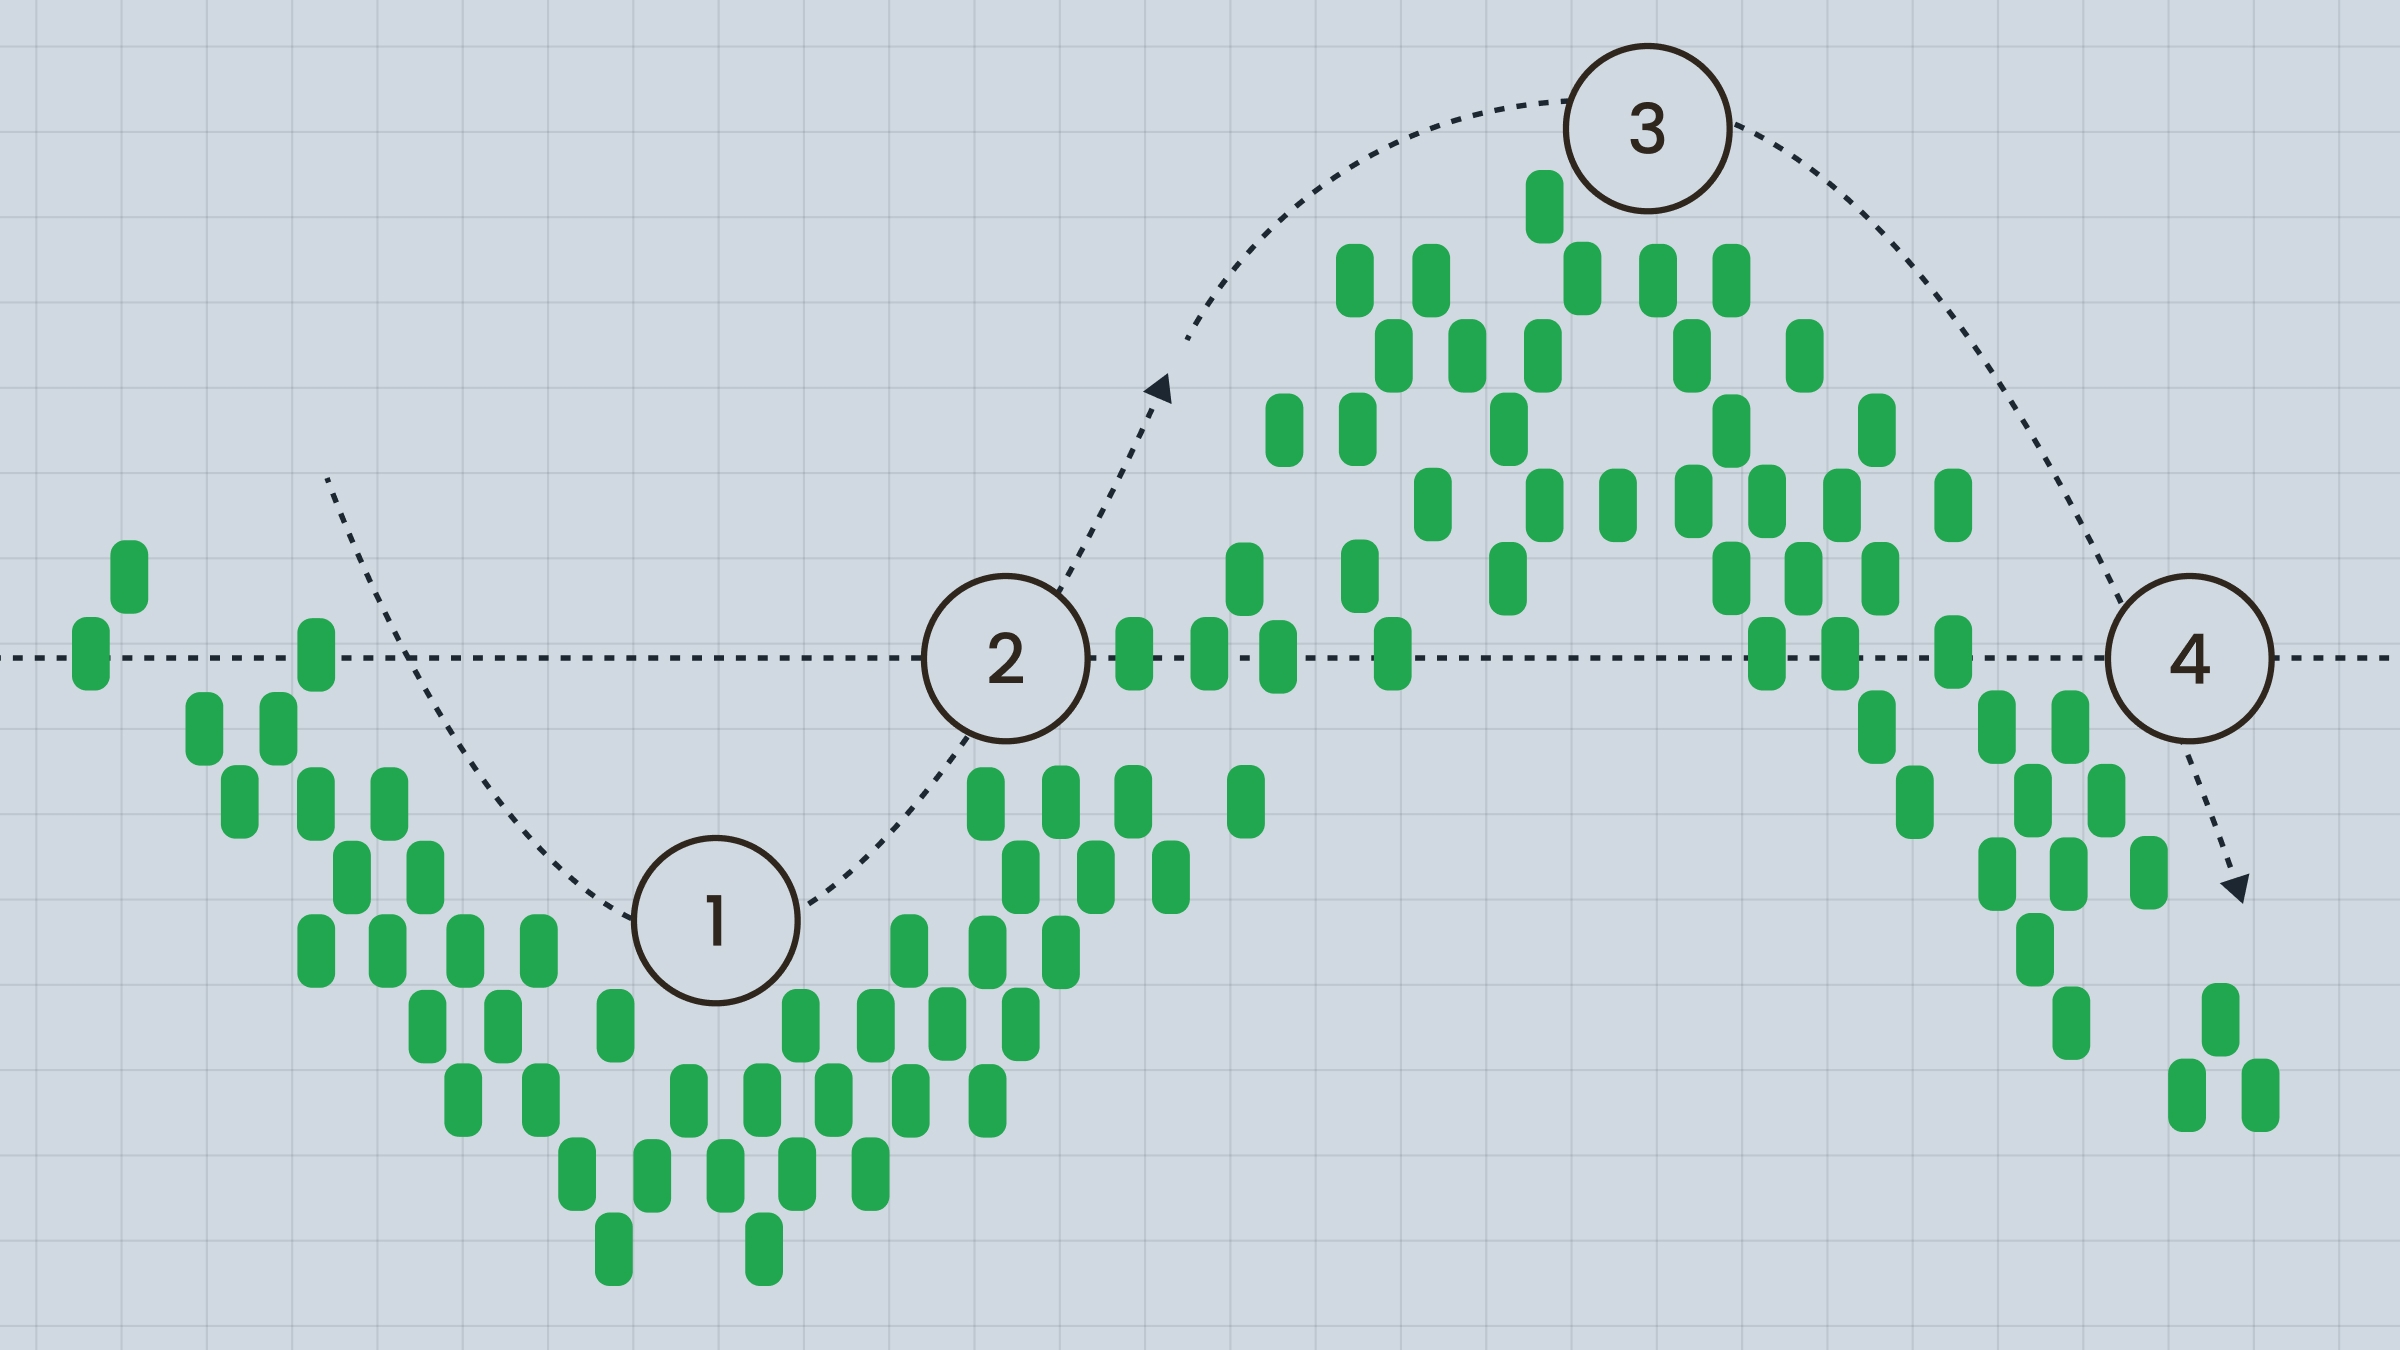
The Auto Wyckoff Schematic Indicator labels springs, up-thrusts, and sign-of-weakness bars as they occur.
Access to historical intraday data enables traders to back-test the rules of pattern recognition that Wyckoff could demonstrate with only a few carefully chosen examples.
Comparison with other trading methods
Wyckoff vs. indicator-based strategies
Traditional technical indicators like RSI or MACD give precise trade signals based on mathematical formulas, whereas the Wyckoff method resorts to a more situational reading of market composition.
An indicator may automatically trigger a market overbought or oversold condition at specific levels, and a Wyckoff trader will determine if those price movements are occurring in an accumulation or distribution phase.
Example
A Wyckoff trader notices an overbought RSI. Instead of selling based on this condition only, the trader looks for a confirmation that the trend is indeed reversing, such as price making higher highs on decreasing volume (a bearish divergence showing a distribution stage). This creates a more comprehensive, context-sensitive approach.
Wyckoff vs. pure price action
Pure price action trading is focused on chart patterns and support/resistance levels. It does not take into account who causes the moves. Wyckoff’s method fills in the gaps by attributing price patterns to smart money actions (the composite man) and focusing on volume.
Example
A price action trader looks at a sideways range at the top of the market and says simply, it is consolidation. A Wyckoff trader looks at proof of distribution within that range. Besides, the Wyckoff approach analyzes volume under price movement and makes it possible to confirm whether a breakout will fail or succeed. This is something impossible when you use pure price action.