How to analyze shifts in open interest
Open interest is a powerful, and often underused tool. While it doesn’t provide clear buy or sell signals on its own, it adds valuable context when combined with price and volume. Understanding shifts in open interest helps you track market sentiment and potential reversals. Here’s how to analyze shifts:
Determine the current price trend.
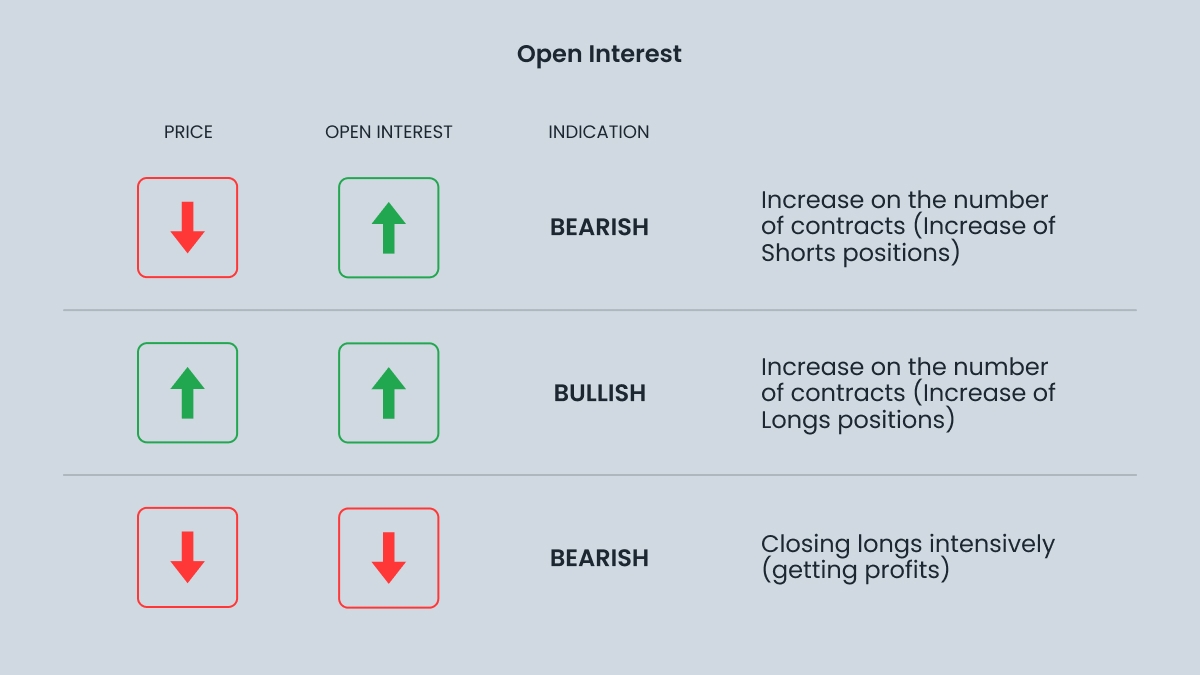
Ask yourself: is open interest increasing, level, or decreasing?
Make sure that volume confirms what open interest is implying.
For example, an ascending equity‑index future with increasing OI and respectable volume indicates overall eager buying. If the price goes up but the OI flattens out and the volume drops off, the rally might be losing internal sponsorship. On the other hand, a horizontal price trend with steadily increasing OI and volume can signify accumulation that results in a breakout.
Look at a December copper futures contract which rises from $3.50 to $4.20 a pound over six weeks as open interest rises from 120 000 to 180 000 contracts to validate the uptrend. Copper grinds out nominal new highs over the next three sessions, but OI falls to 170 000 and daily volume diminishes. The divergence warns longs are being distributed into strength. A break below near-term support on a later session confirms the warning and signals traders who utilized the OI signal to tighten risk.
Limitations and best practices
Open interest is a useful tool, but you shouldn’t rely on it solely, since it can’t really forecast price action.
Open interest is updated only once per day, so the data is unavoidably delayed. Seasonal rollovers also distort headline figures as market participants roll out of an expiring contract into the next month. Look at expiration cycles and continuous datasets to prevent misleading impressions.
OI doesn't show direction. Rising open interest can mean more longs or more shorts since each contract represents both sides of the trade. A solution is to combine it with price action, options skew or trader classification data like the CFTC's Commitment of Traders reports for stronger confirmation.
Use open interest to paint a clearer picture and add context. Don’t forget to monitor volume and trendlines. In options, analyze open interest by strike price and expiry to identify key levels.
Explore smart investing with FBS — trade now!